|
||
|
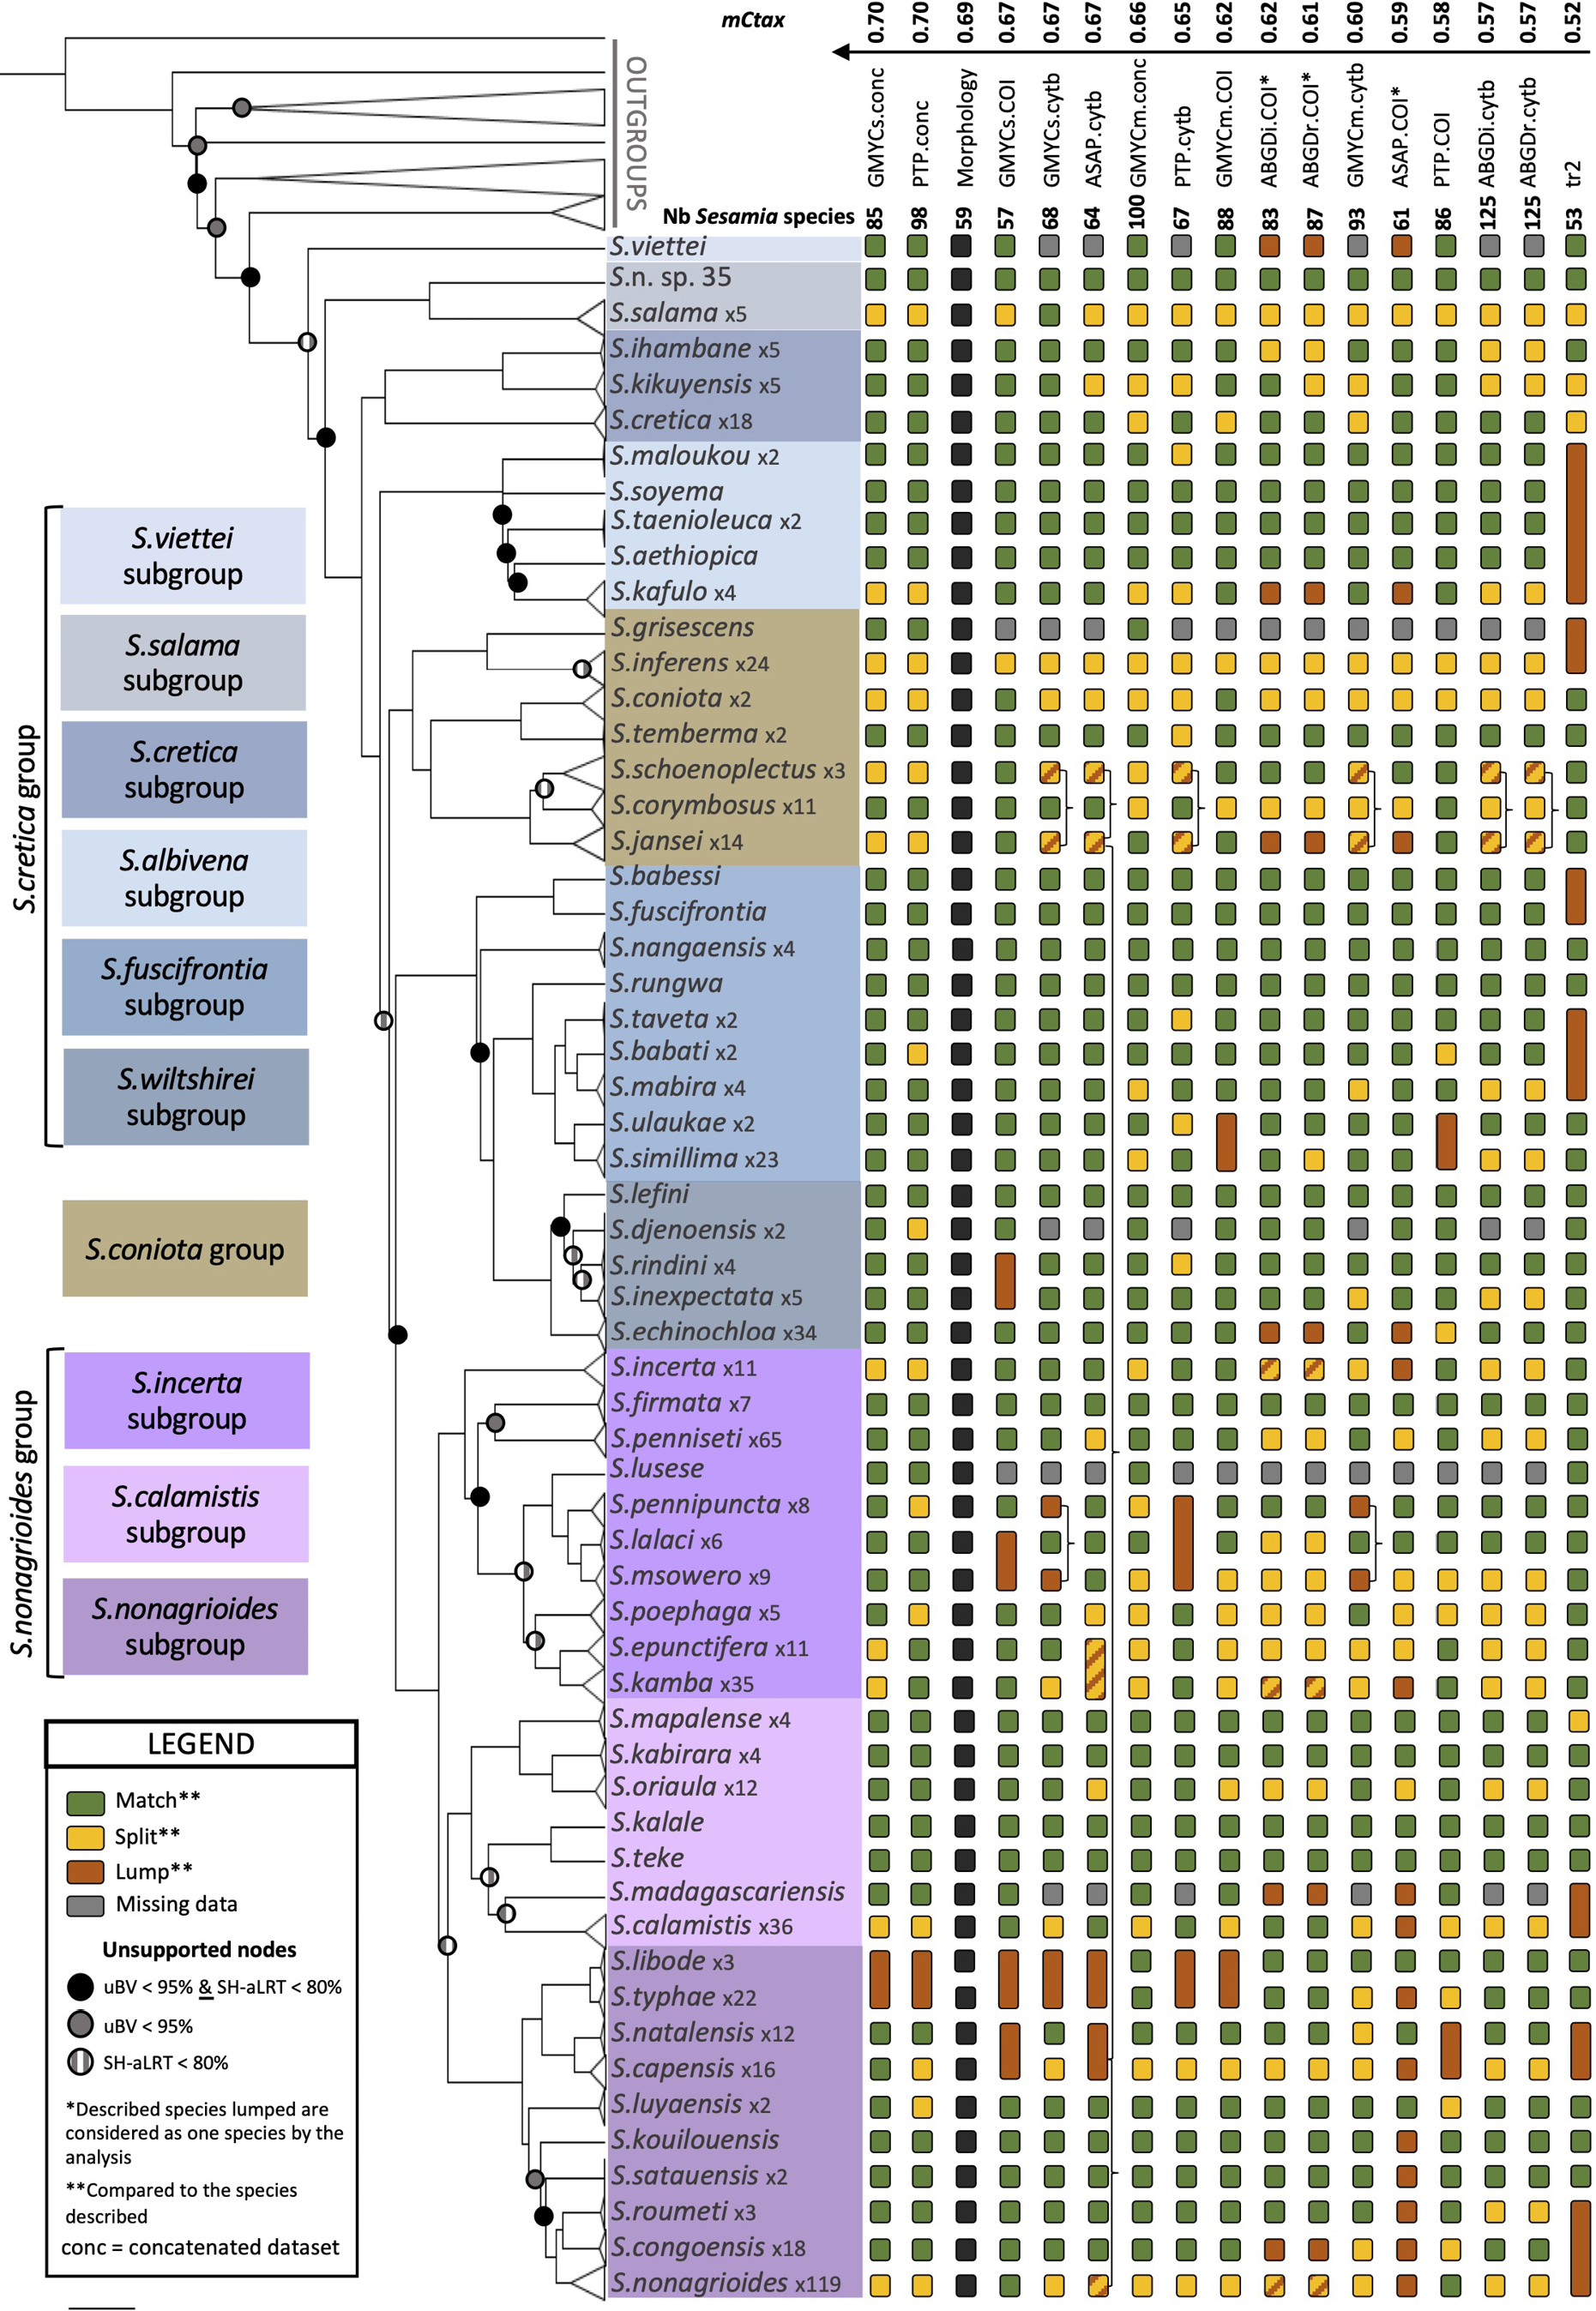
Maximum likelihood topology resulting from the analysis of the concatenated dataset, supplemented by the results of the SD analyses. The tree is shown on the left along with information on clade support for major nodes (S = supported, NS = not supported). The results of molecular analyses are displayed on the right, sorted by mCtax values. The bars are coloured in green, yellow or red, depending on whether a given analysis matches, splits or merges the number of described species, respectively. Analysis type, mCtax, Ctax (between morphology and a given analysis) and the number of species found (Nb species) are summarised in the panel at bottom left. |