|
||
|
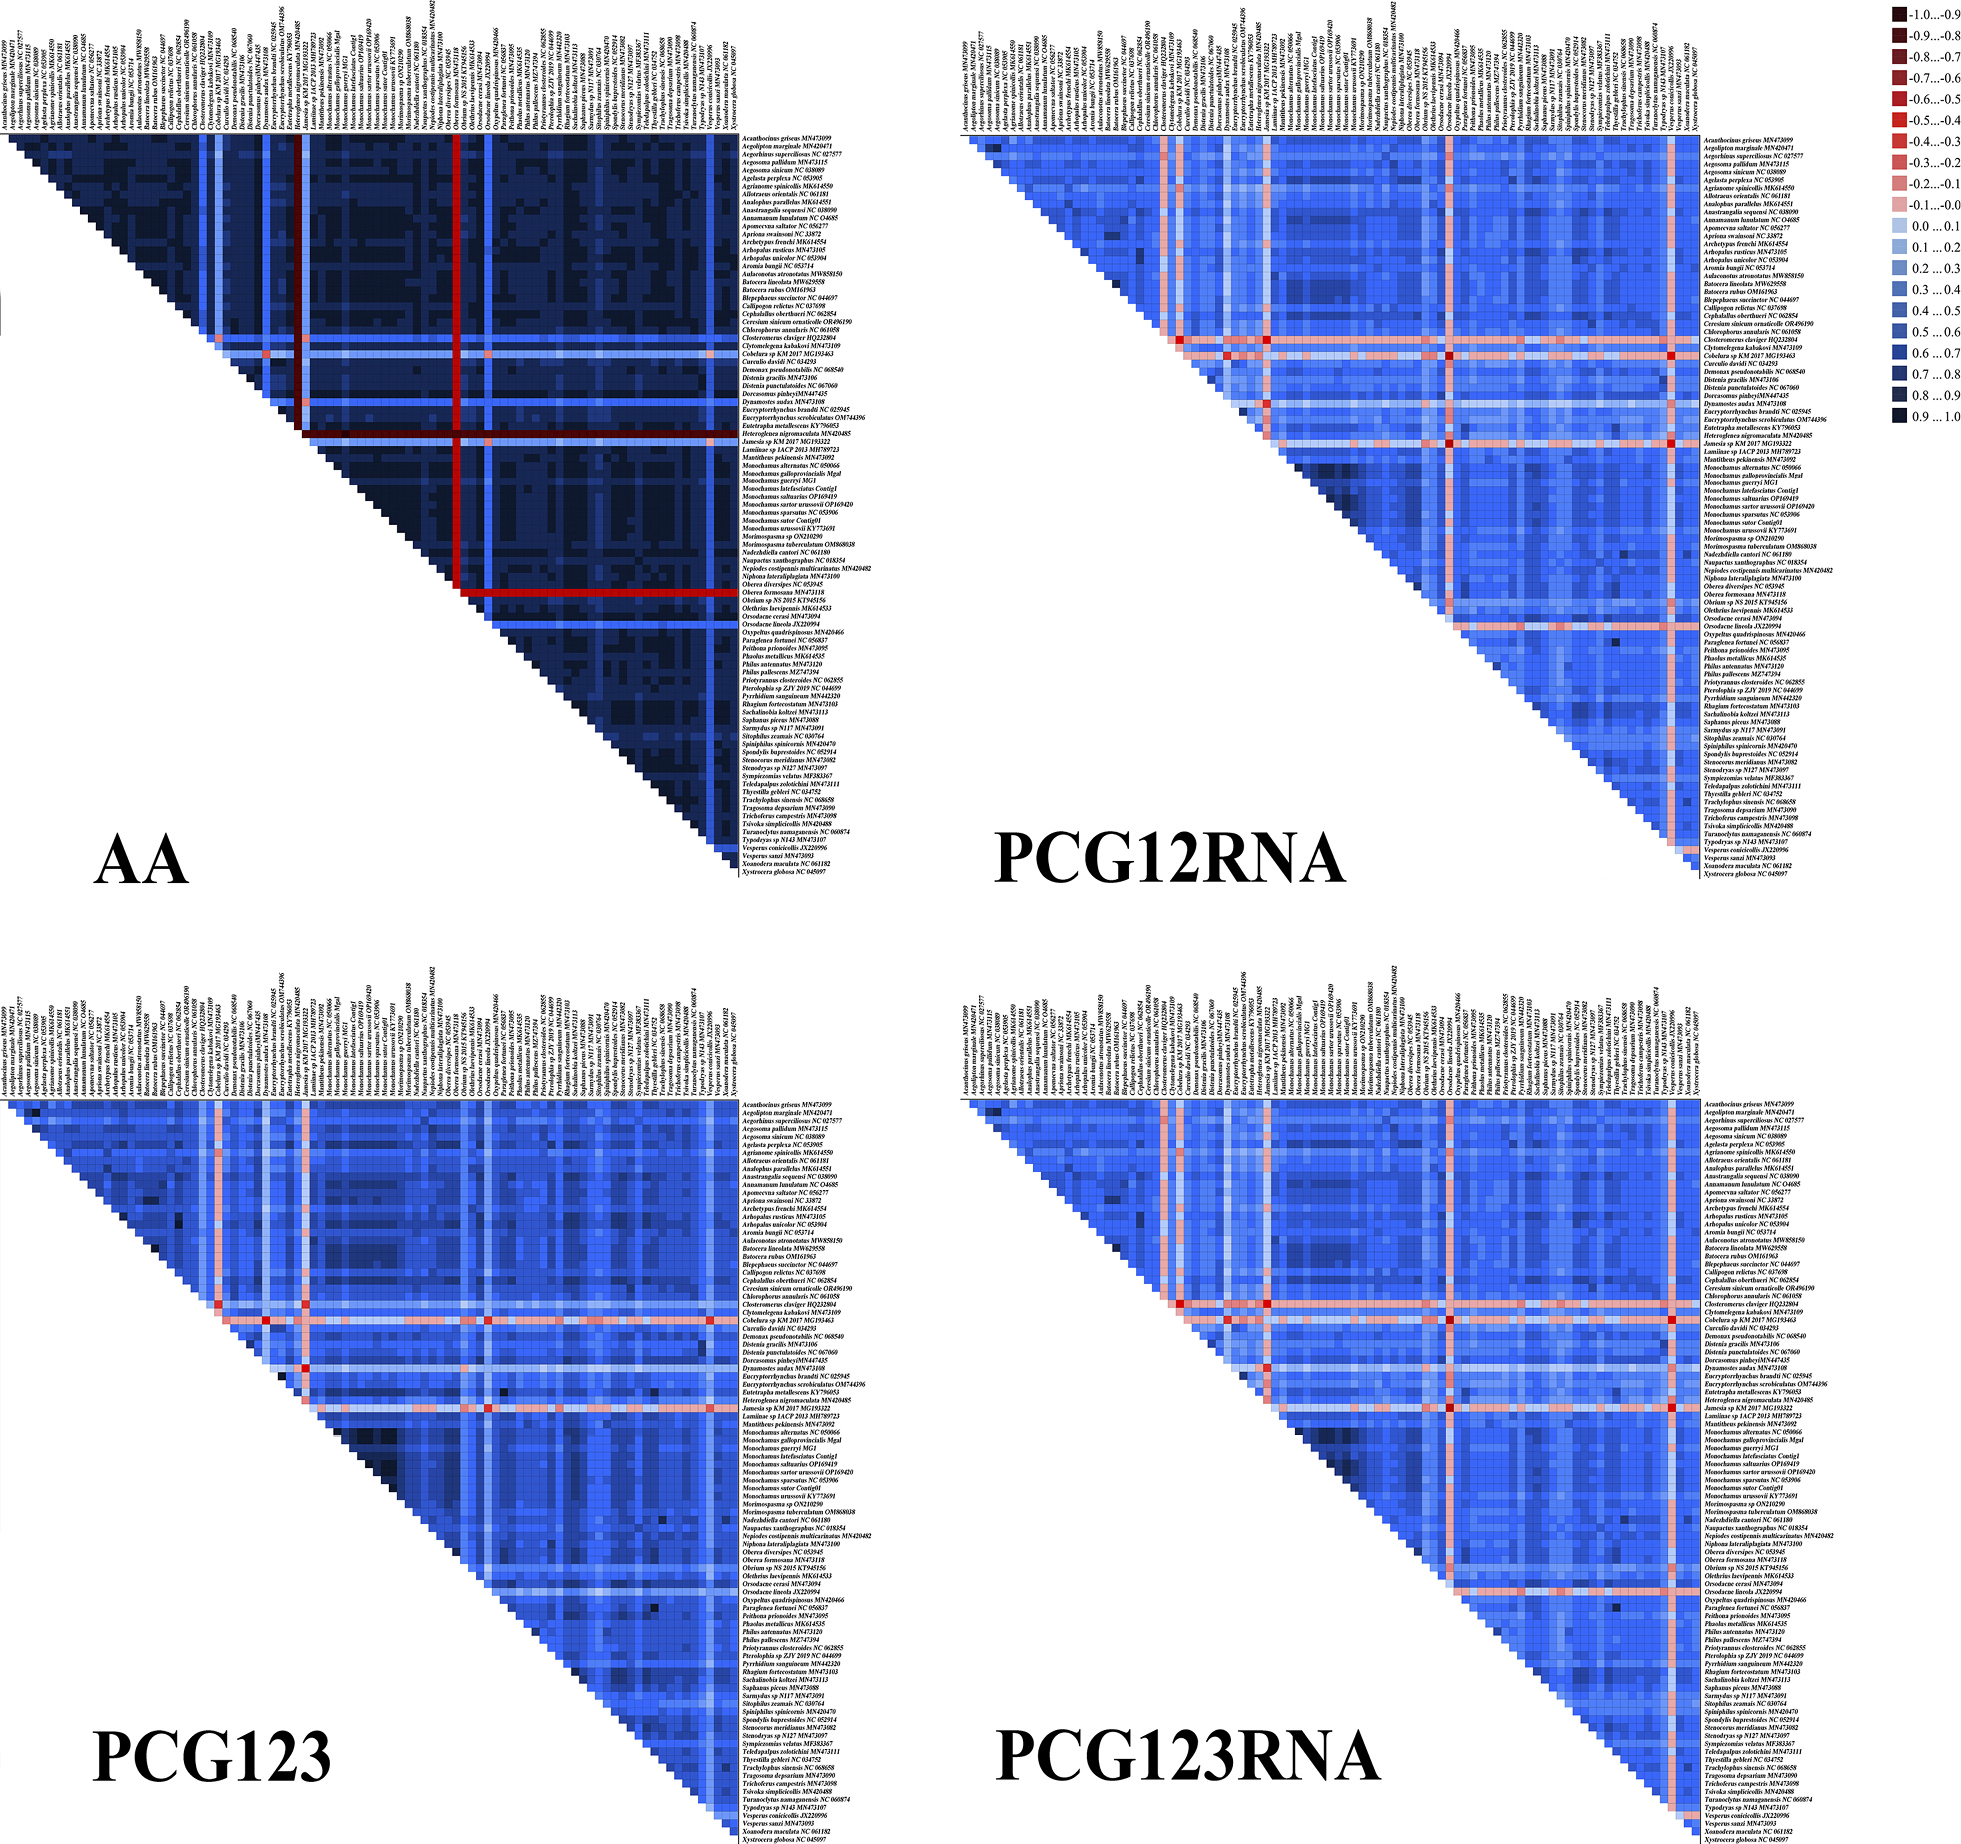
Heterogeneity of the sequence composition of the mitochondrial genomes in different datasets. The pairwise Aliscore values are indicated by colored squares. Darker colors indicate full random similarity, and lighter colors indicate the opposite. All taxon names are listed on the left side of the heat map. |