|
||
|
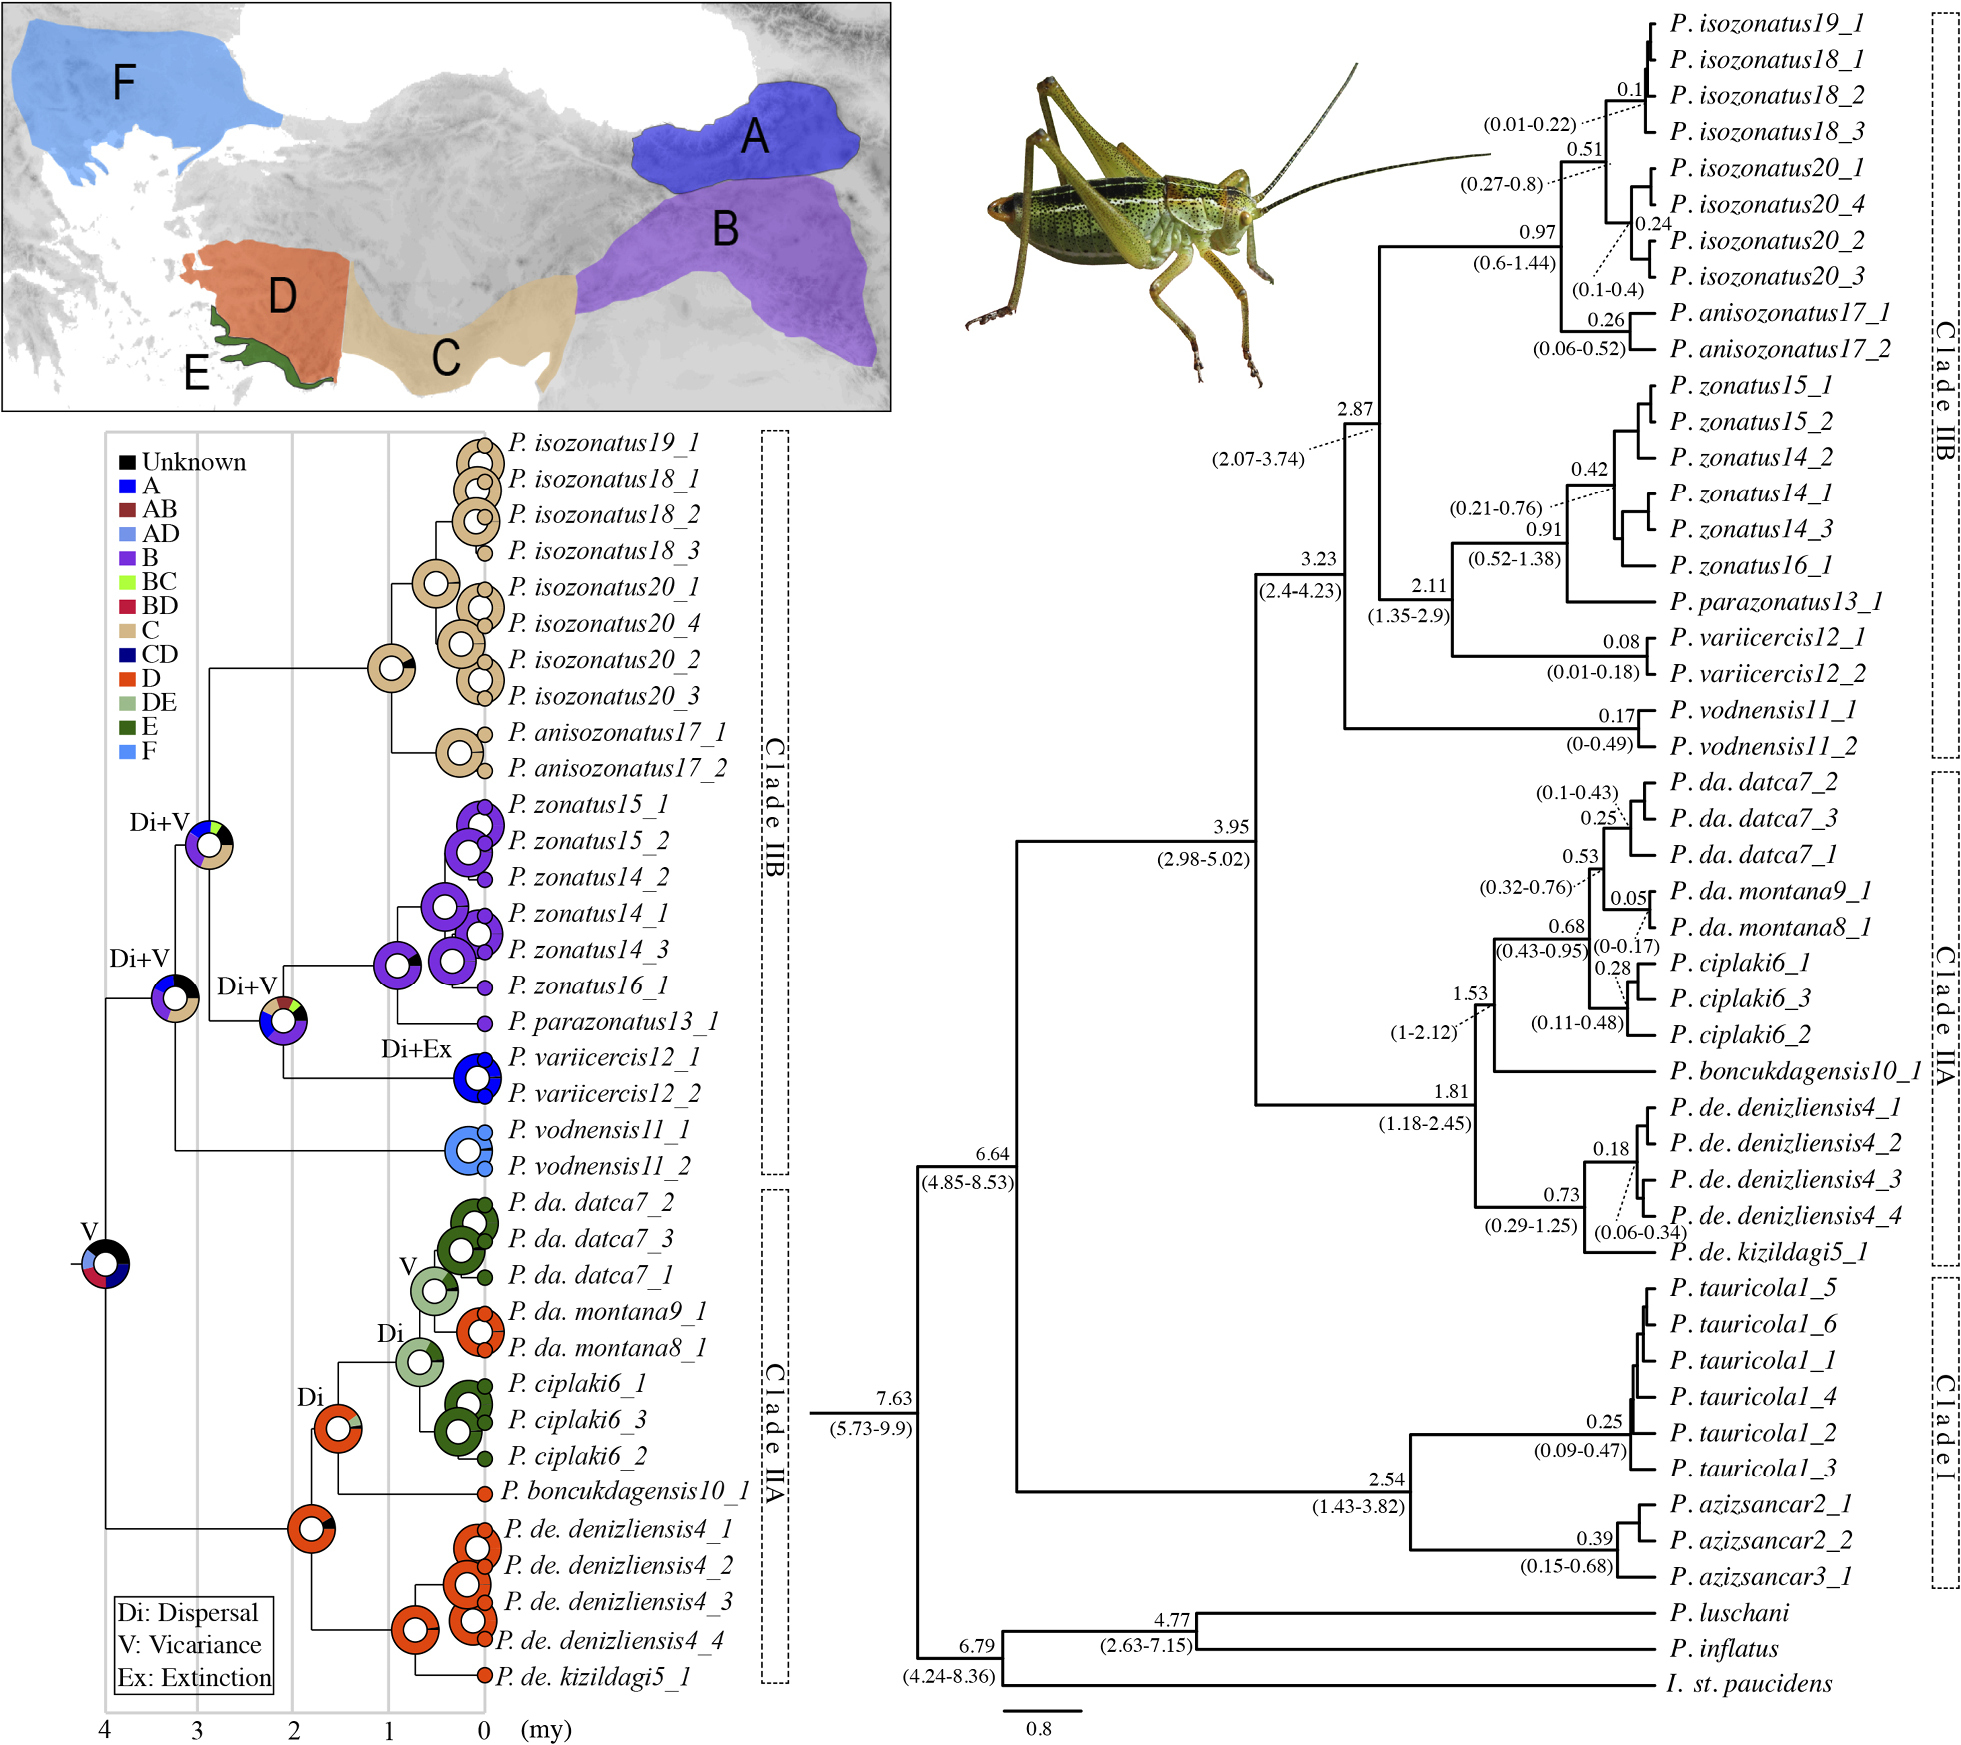
Right panel The chronogram showing radiation time of P. zonatus group obtained by a BEAST analysis applied to 44 ingroup + 3 outgroup concatenated sequences of COI+ND2+VAL; (Node values: values shown above the branches indicate time (myr), while values below the branches indicate HPD intervals.) The haplotype names are according to Table 1 and Figure 2. Left panel Ancestral area reconstruction (most likely state) of the P. zonatus group based on the DEC model. The coloured circles at the tree nodes correspond to the areas ancestral for the clade. Colours correspond to generalized geographic areas mapped in the upper left corner (see the text for details) |