|
||
|
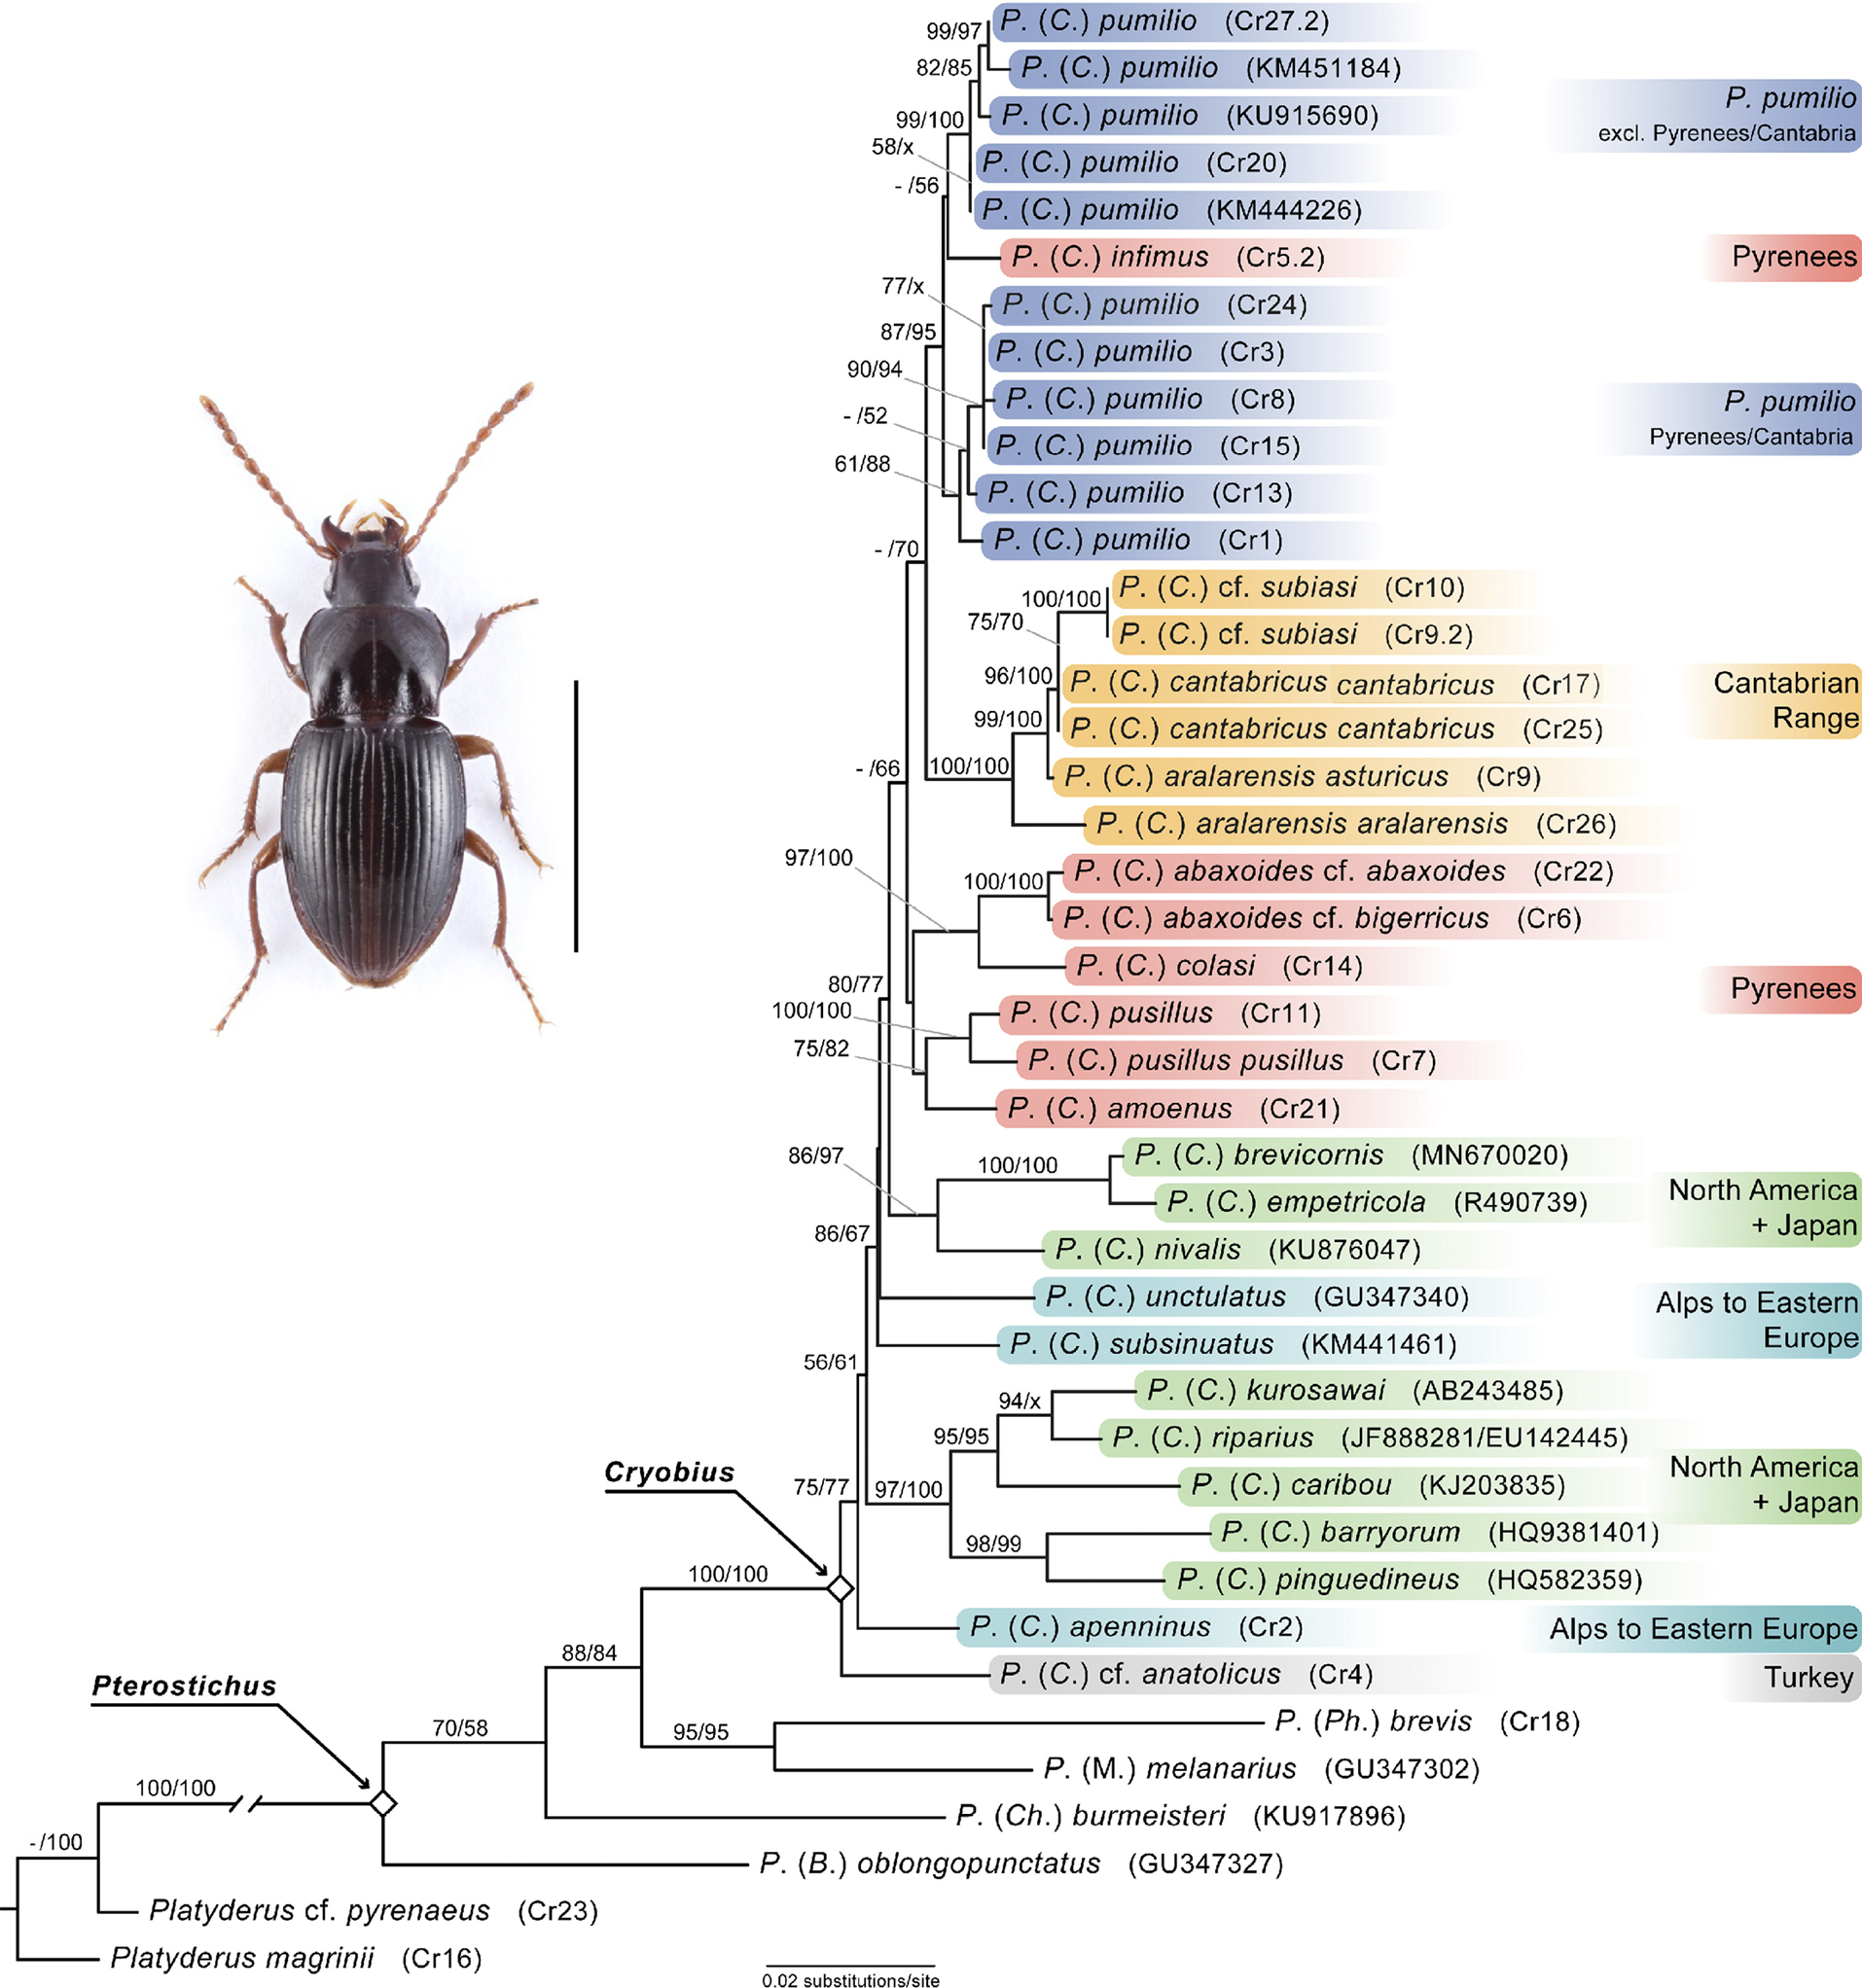
Combined tree of CO1, 28S, 18S and 16S sequences based on maximum likelihood (ML) analysis. Numbers in nodes indicate ML bootstrap value / Bayesian posterior probability (both: only when >50). Coloration indicates species distribution patterns of Cryobius. “–” poorly supported node (value <50), “x” node not recovered by Bayesian analysis. P. = Pterostichus, C. = Cryobius, B. = Bothriopterus, Ch. = Cheporus, M. = Morphnosoma, Ph. = Parahaptoderus. In brackets: specimen code (CrXX, this study) or GenBank accession number. P. (C.) riparius: chimera (JF888281+EU142445). Specimen: Pterostichus pumilio, scale bar: 3 mm. |