|
||
|
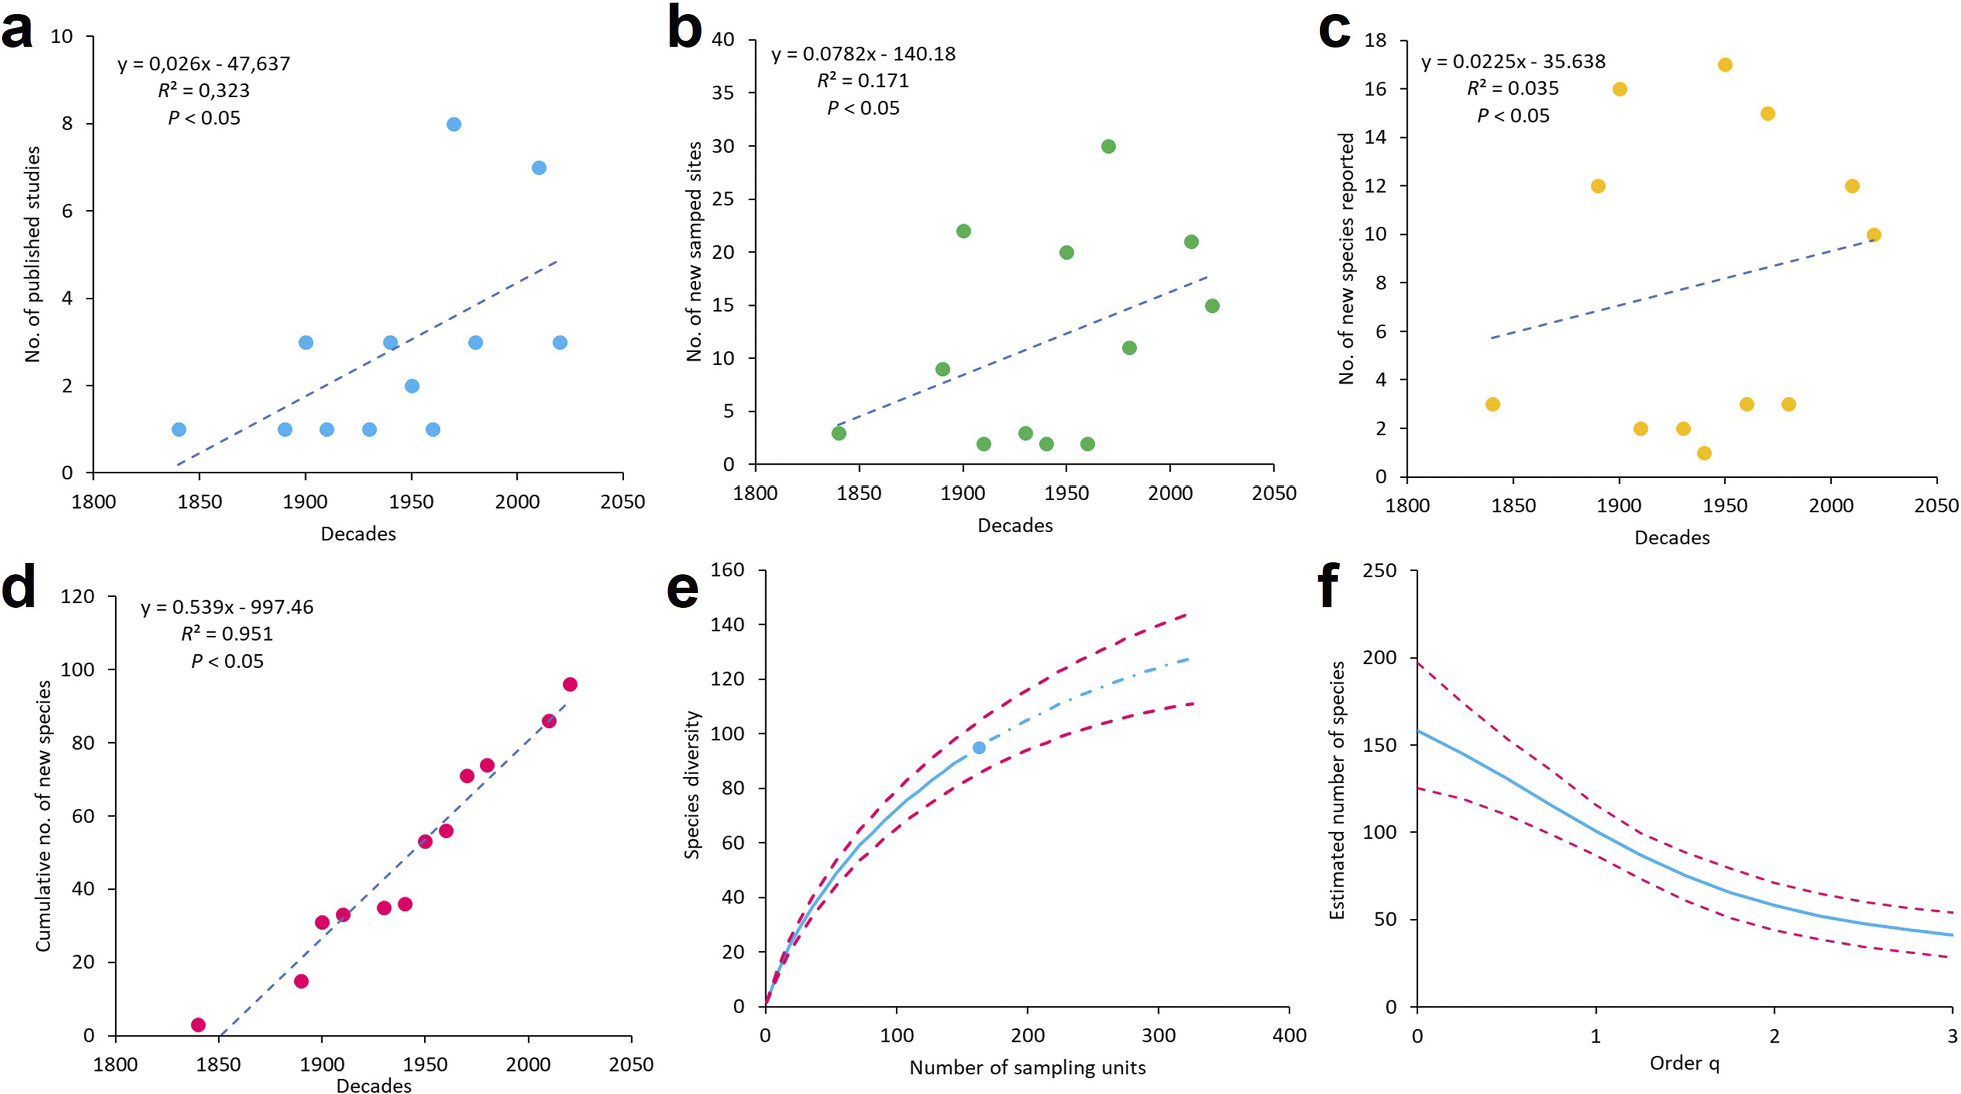
State of knowledge of Chilean millipedes. a Number of studies published per decade. b Number of new sites sampled per decade. c Number of new species reported per decade. d Cumulative number of new species per decade. e Rarefaction curves (solid trend line), extrapolation curves (dash-dotted line) and their lower and upper 95% confidence intervals (dashed line). The point between both curves represents the number of sites where millipedes have been sampled in Chile. f Asymptotic estimate of millipede diversity in Chile (solid trend line) and its lower and upper 95% confidence intervals (dashed line). |