|
||
|
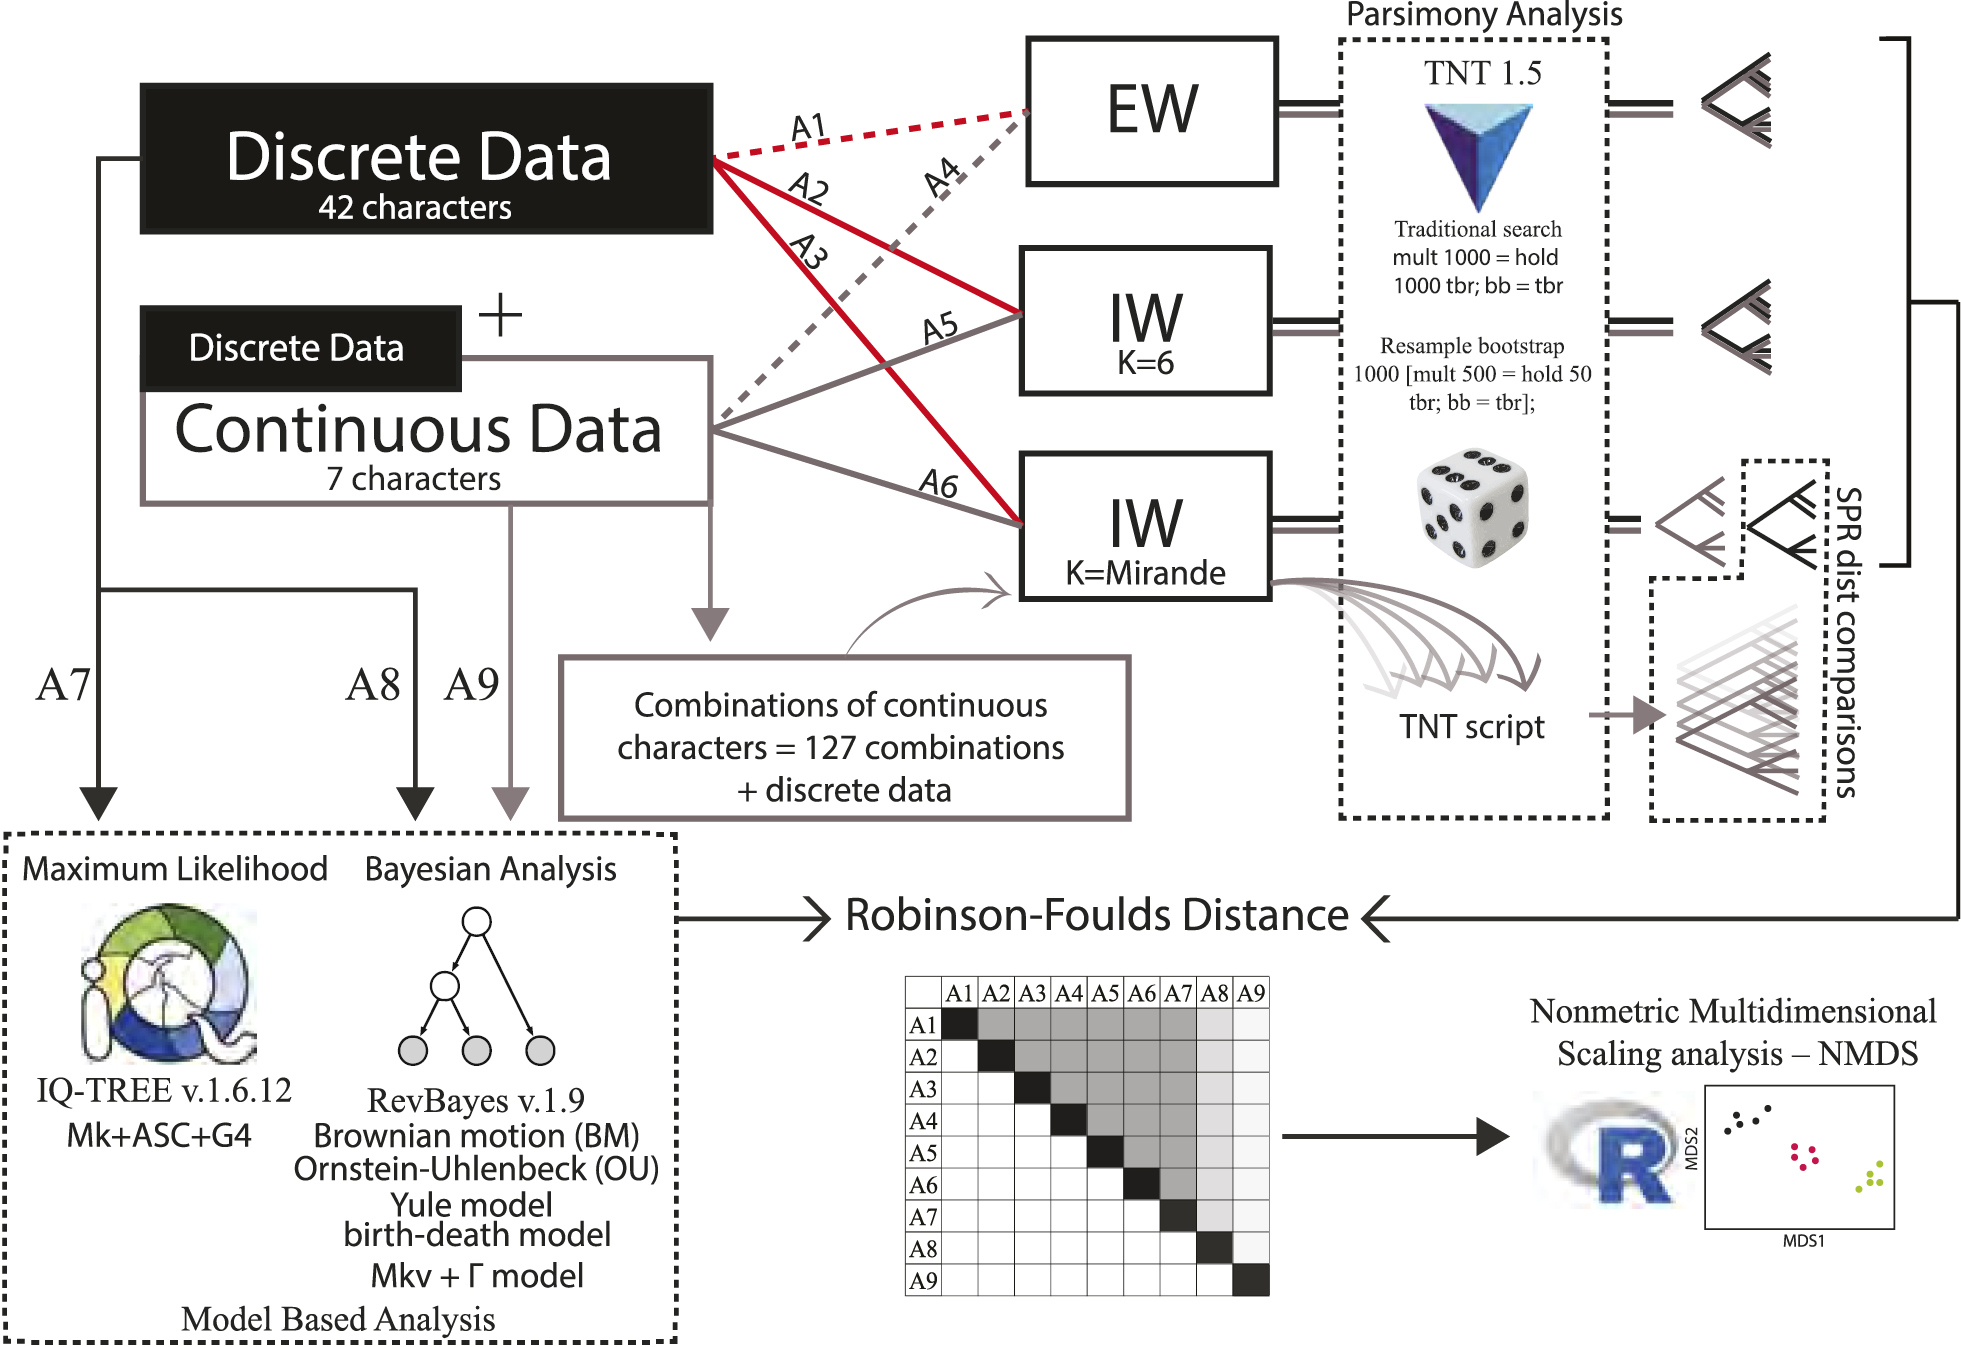
Scheme of all analyses performed with different matrices, combinations of continuous characters and inferences. First, maximum parsimony analyses were performed in TNT v.1.5, under two weighting schemes: equal weights (dotted lines) and implied weights (solid lines). Groups of analyses were conducted on either the character matrix considering only the 42 discrete characters (reds lines) or on the combined dataset, including seven continuous and 42 discrete characters (grey lines). Three schemes combining character matrices with different weights were applied, totalling six analyses: (1) the matrices of analyses one (A1) and four (A4) were assigned equal weights; (2) the same matrices, now in the analyses two (A2) and five (A5), respectively, were submitted to an implicit weighting scheme, with constant K equal to six; (3) the same matrices, now in the analyses three (A3) and six (A6), respectively, were submitted to implicit weightings, but with a constant K estimated after exploring different concavities. Second, a total of 127 combinations were added gradually to the matrix of discrete characters submitted to A3, because the estimated K-value was quite close to that of A6. The Subtree Pruning Regrafting distance (SPR dist) and parsimony character bootstrap were used in a way to account for differences, similarities, and special behaviours among topologies (and nodes) found in each iteration of the procedure and the topology (or consensus topology) found in A3. Apart from maximum parsimony analyses, in analysis seven (A7), maximum likelihood inference was conducted for the matrix of only discrete characters using W-IQ-TREE v.1.6.12, with default parameters (see the text for more details). For Bayesian inferences, analysis eight (A8) was performed on the matrix with only discrete characters, while the analysis nine (A9) used the matrix with all datasets combined. It was partitioned into discrete and continuous subsets, and the appropriate evolutionary models were applied to each partition separately. The partitioned matrices were used in REVBAYES v.1.9, and six evolutionary scenarios were established, given the presence of continuous data and its phenotypic variance (see the text for more details). The Robinson–Foulds symmetric absolute distance was used to compare the topologies obtained. Accordingly, a representation of differences and similarities between the topologies found under different approaches was summarised in a nonmetric multidimensional scaling analysis biplot, after calculating a triangular Robinson–Foulds distance matrix. |