|
||
|
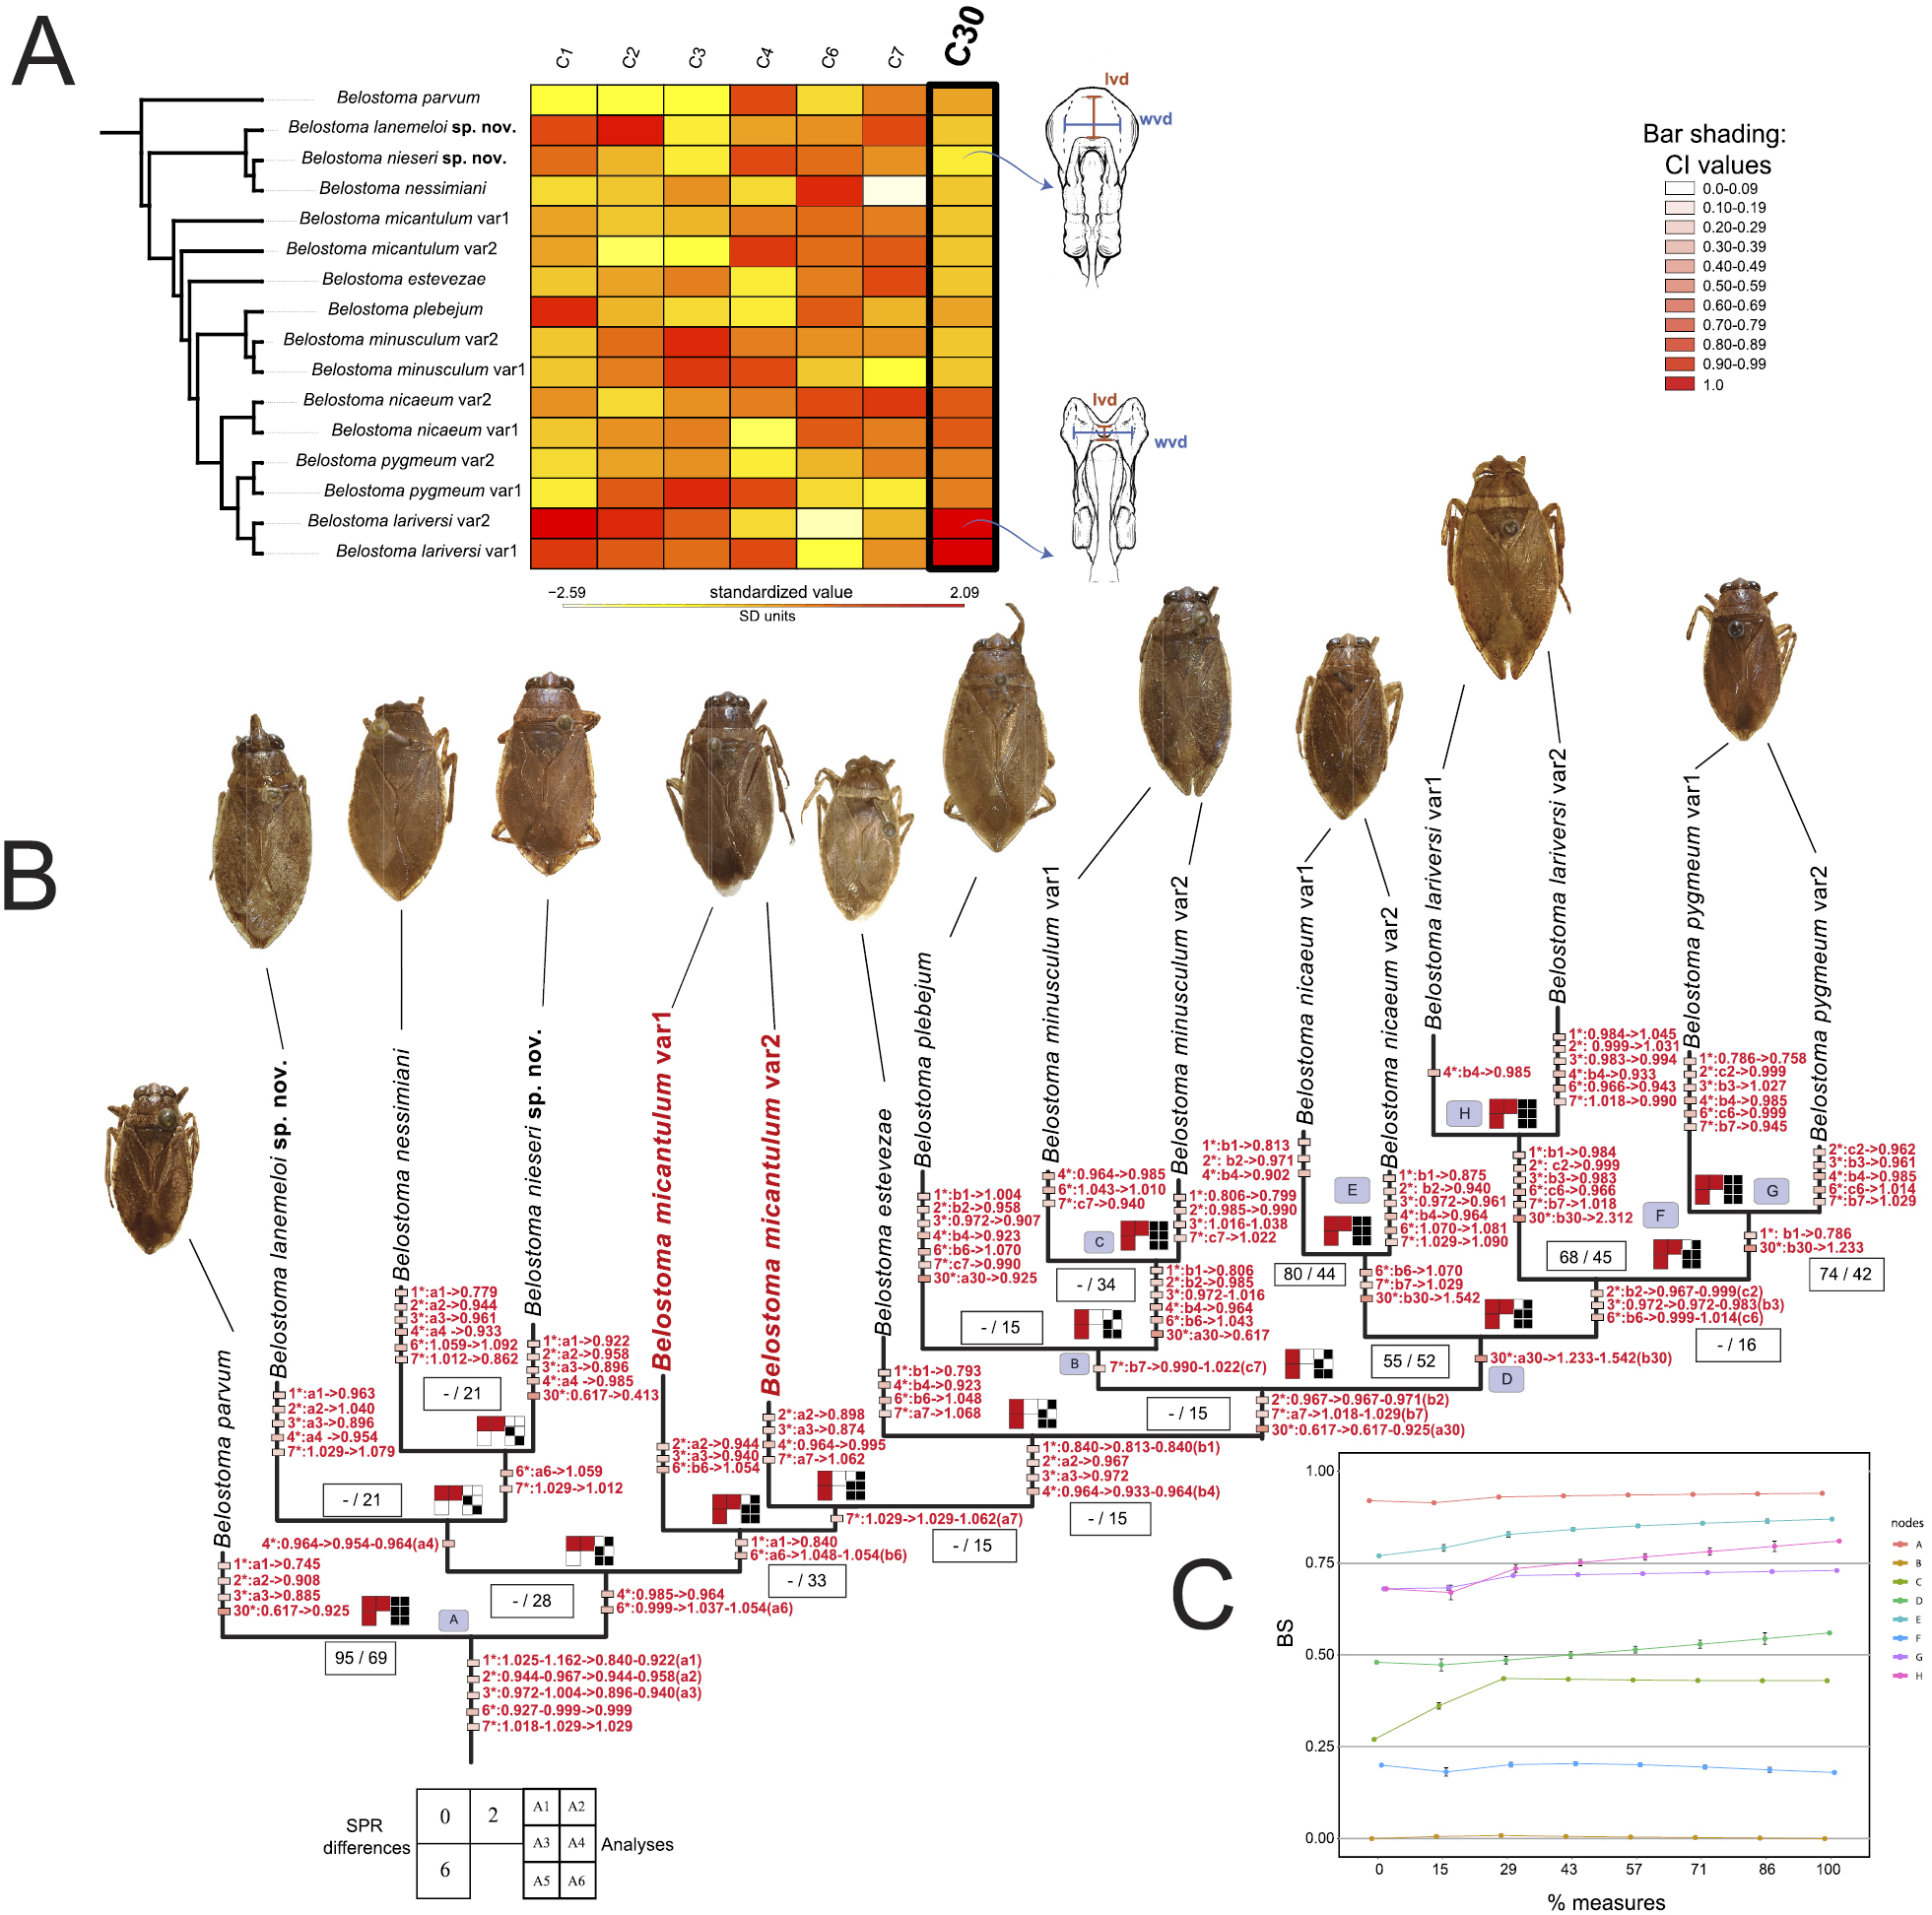
Maximum parsimony inference from analysis six (all datasets under implied weights, K = 3). Consensus of the four most parsimonious trees (L = 142.3, CI = 0.44, RI = 0.74, fit = 14.61) with continuous characters optimised. A The continuous characters and their states are indicated by coloured rectangles on the left-top corner and are coloured according to their standardised values. Measurements based on male genitalia are indicated on male genitalia sketches B Codes after ln-transformed values referring to the ancestral state reconstructions presented on nodes were used in order to reduce space. Numbers inside rectangles above or below branches refer to bootstrap (if > 50%) with a Poisson correction and relative Bremer supports, respectively. Coloured squares refer to consistency index values. Letters inside grey squares refer to nodes that were also recovered in all bootstrap resamples C A line graph illustrates trends in bootstrap support of those nodes, as long as combinations of continuous characters were used together with discrete characters. Black and red rectangles indicate the existence of a node recovered by a maximum parsimony analysis and with a combination of continuous characters (indicated by the Subtree Pruning Regrafting distance), respectively. Outgroups were omitted. Abbreviations: BS, bootstrap support; CI, consistency index; C1, continuous character 1; C2, continuous character 2; C3, continuous character 3; C4, continuous character 4; C6, continuous character 6; C7, continuous character 7; C30, continuous character 30; lvd, medial length of the diverticulum; SPR differences, the Subtree Pruning Regrafting distance; wvd, largest width of the diverticulum. |