|
||
|
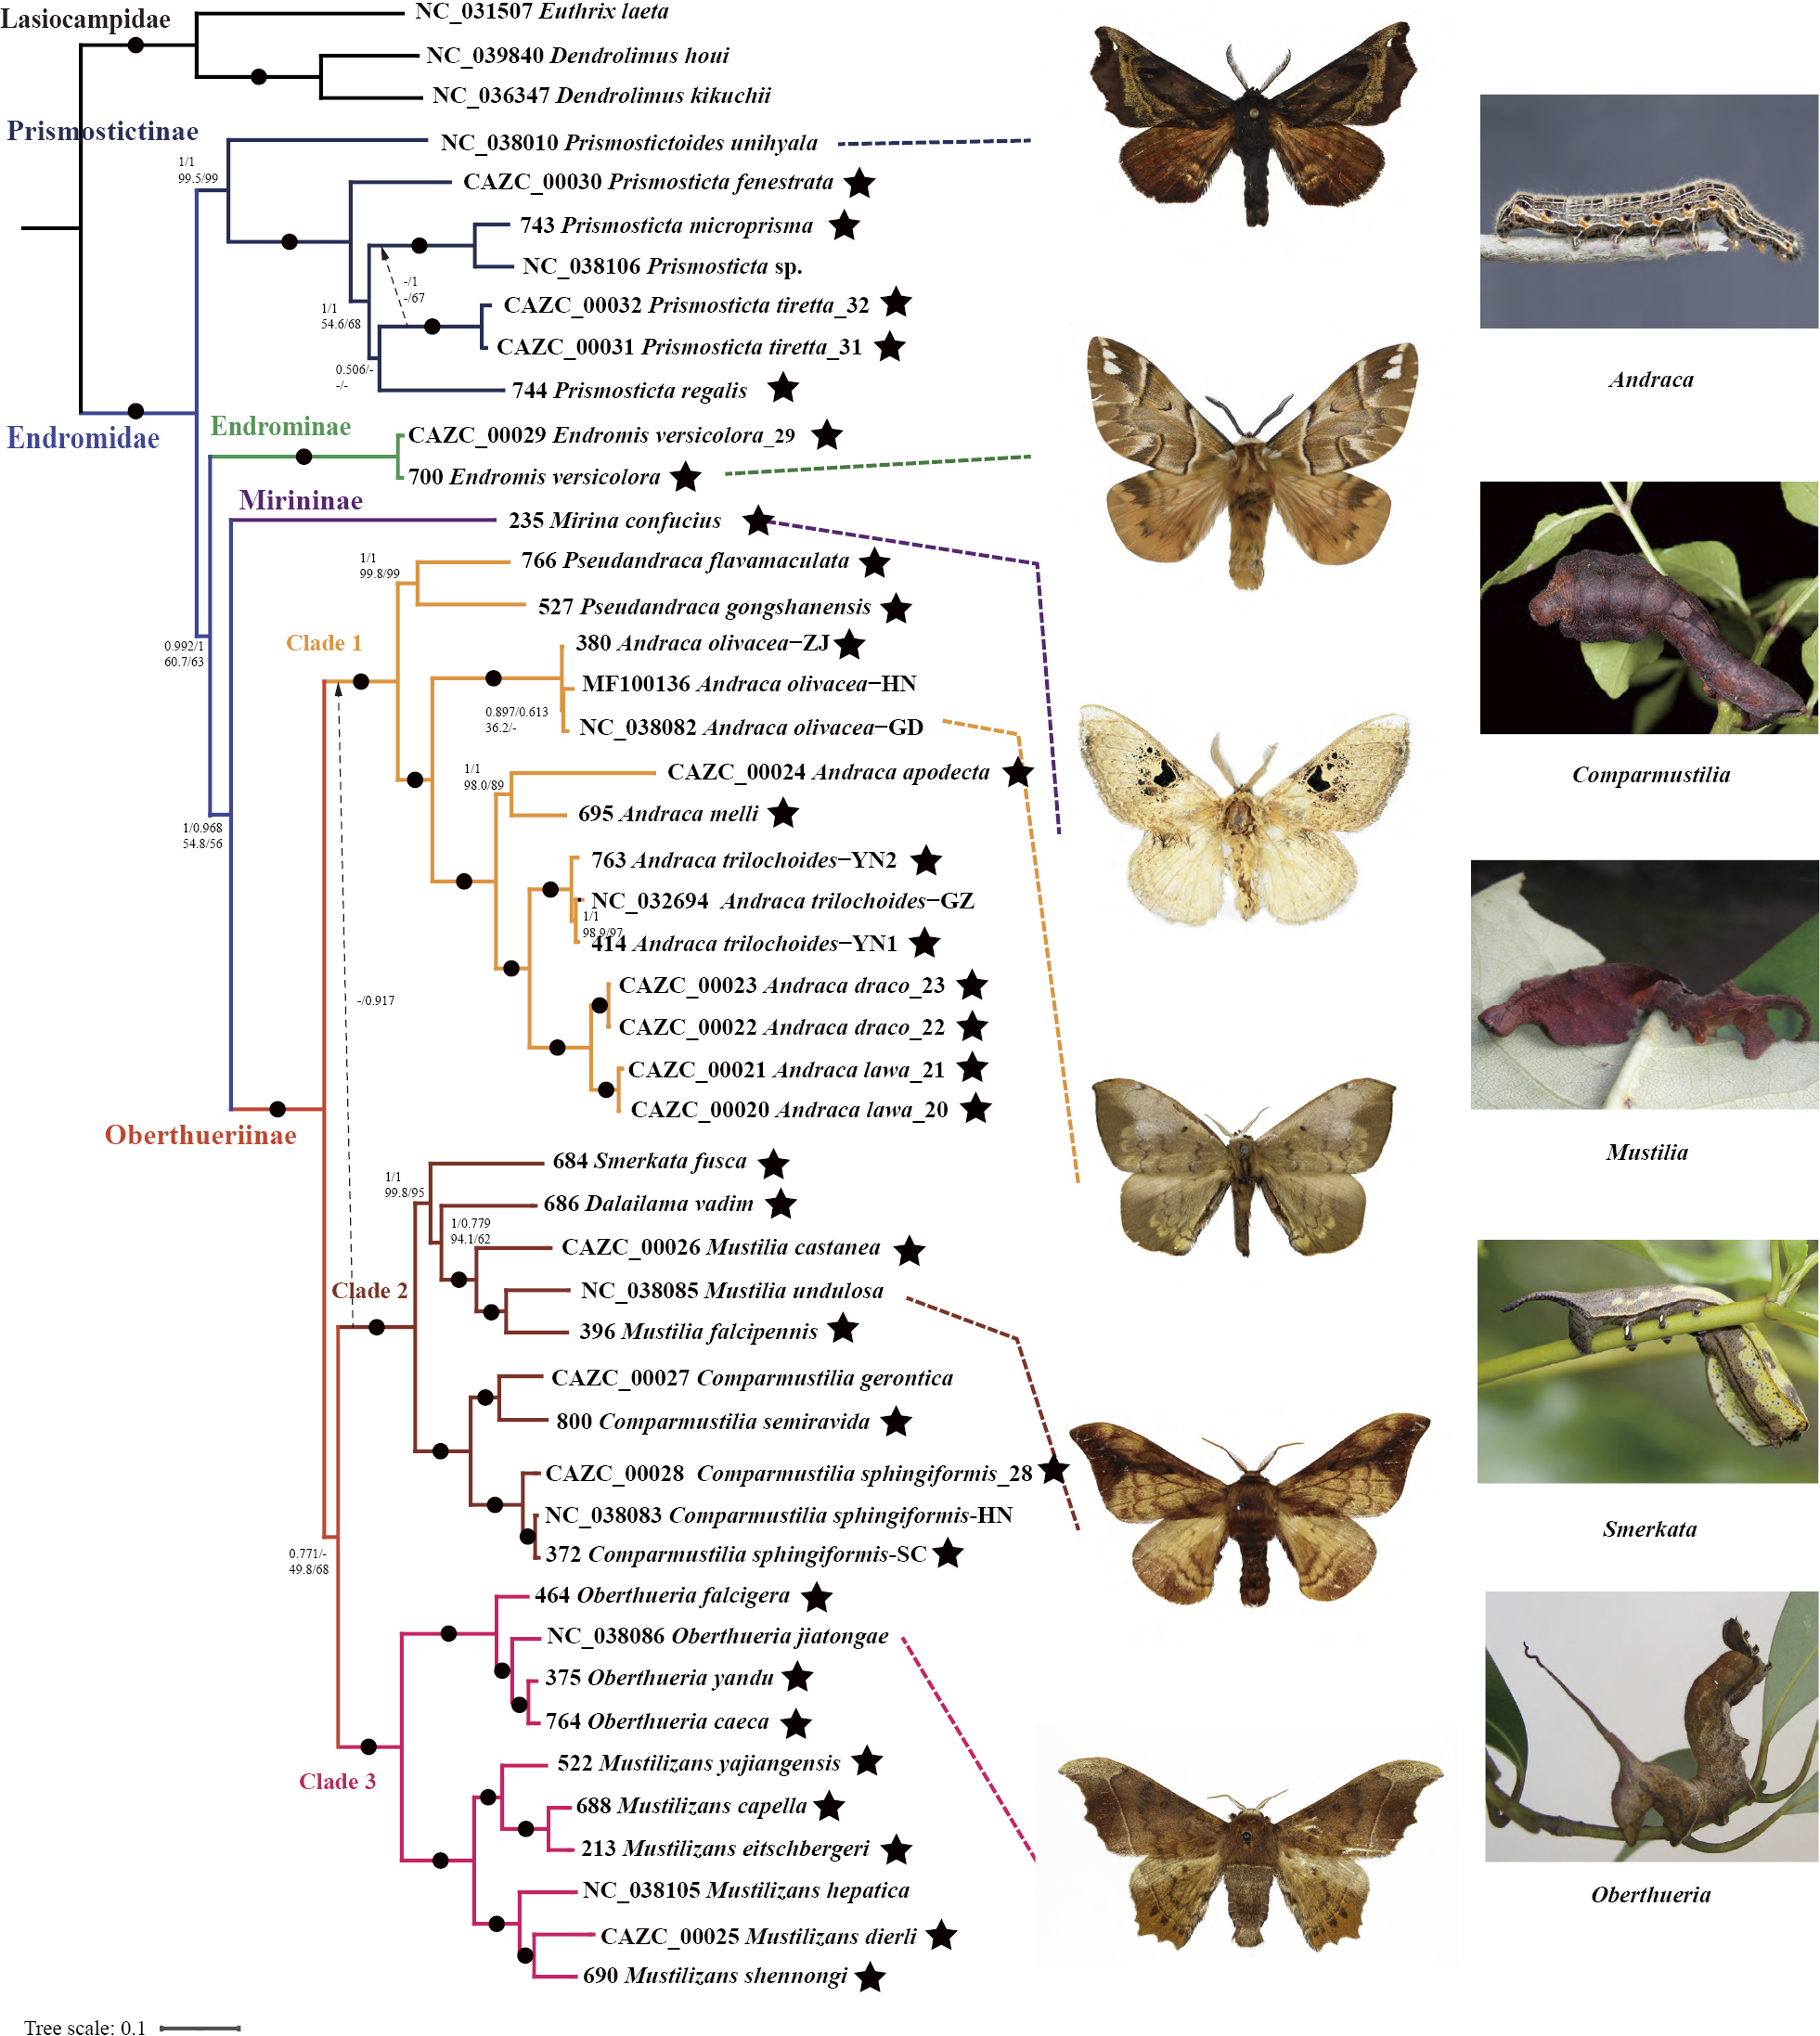
Phylogeny of Endromidae inferred from different data sets (13PCGs-AA, 13PCGs) using Bayesian inference and maximum likelihood analyses. Numbers above branches are posterior probabilities (BI PP), beneath which are bootstrap percentages (ML BP) for 1000 replicates; nodes with maximum support values are marked with a black dot instead. Dashed arrows (two in total) identify alternative topologies (relative to the topology shown) that receive at least 70% bootstrap support by one or more of the approaches. The asterisks indicate newly sequenced mitochondrial genomes. |